What is it?
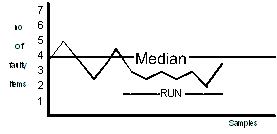
A run chart is a simple graph for monitoring a process or activity..
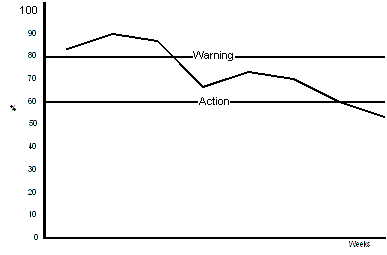
A control chart has statistically determined action lines added. The line is used to give a clear indication of when the process needs investigating.
When to use it
- Gathering data
- Analysing data
- Implementing and testing solutions
- Ensuring continuous improvements
What does it achieve?
A run chart is used to monitor a process, so any trends or runs can easily be seen.
By adding a predetermined action line, the process can be monitored to see if it is within the preset limit.
Run chart summary
To construct a run chart you must know:
- What is the problem
- What data is required
- Where is the data collected
- When is the data collected
- How is the data collected
- How to choose the scale for the X and Y axis
Control chart summary
Control charts are used to monitor a process within preset limits, these limits can be:
- Design specifications
- The standard deviation of the sample data
- The average sample X and average range R
- Limits fixed by law or economics
- Investigation is required when:
- 1 point goes past the action line
- 2 points go past the warning line
Typical control chart

