What is it?
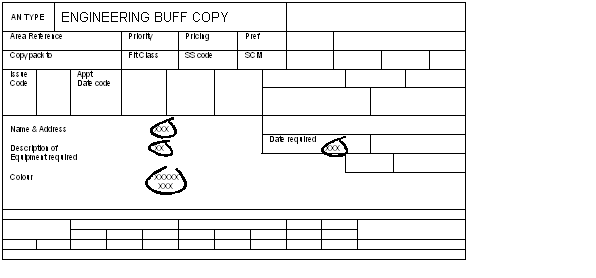
Concentration Diagrams are used to show the location of events or problems.
When to use it
- Gathering data
- Analysing data
- Implementing and testing solutions
What does it achieve?
Where there is a need to report both the frequency of an occurrence, e.g. a defect in a process or product, and the loaction of each occurrence, a concentraion diagram can be used to produce a visual record.
Key steps
- Decide data required
- Devise data diagram
- Test diagram
- Review and revise
- Design master diagram
- Gather data
Typical concentration diagram
